This article explores what the factors are that can accelerate DOOH towards the “holy grail” of cross-platform media compatibility. In this article we will explore mobile measurement for OOH and compare it with Quividi’s model and methodology. This article is also an excerpt from a larger work, Quividi’s DOOH Audience Impressions White Paper which can be downloaded here.
A popular modern alternative method to Quividi for quantifying audience in OOH/DOOH is to use mobile device or user detection. In this article, we will compare the two.
Mobile Data Sources
There are 3 main mobile data sources:

These mobile data sources are quite different in nature and have their own advantages and disadvantages. Bid stream data, for example, is by far the most common, but it carries with it some pitfalls. We evaluate it, and other mobile data sources, along the following 5 areas of advertiser accountability.
Mobile Data Density
With the exception of passive Wi-Fi based measurement, mobile data suffers from data density problems. This is because any particular data provider only captures a subset of the audience, e.g. a telecom only has their own subscribers’ data. In locations where foot traffic is relatively low, this sub-sampling may be below the limit of statistical significance. App/bid stream data, in particular, suffers from low data density.
Mobile Data Fidelity
There is a real challenge converting mobile device data to human-valid, cross-platform impressions for a few reasons. First, if it uses bid stream data, then it is susceptible to the same ad fraud as online ads. Second, it is difficult to discern whether the owner of the mobile device is facing the screen or not. Third, it is difficult to geofence mobile data to ensure the owner is within the viewable zone. This is particularly true with local mobile measurement solutions like those based on Wi-Fi which can detect through walls and floors, and GPS-based positioning which does not work indoors.
Mobile Data Recency
Typically, mobile data such as bid stream or carrier data is gathered after the fact and used as historical data. This is related to the fact that it is difficult to get privacy-clean data to the point of playback in real-time.
Mobile-CMS Integration
Mobile Data Privacy
Apple and Google are taking privacy counter-measures such as resetting device network MAC addresses to prevent apps from tracking their users. There is a tug-of-war between tracking systems, anti-tracking systems, and privacy protection agencies and legislations, so this will likely evolve in the future.
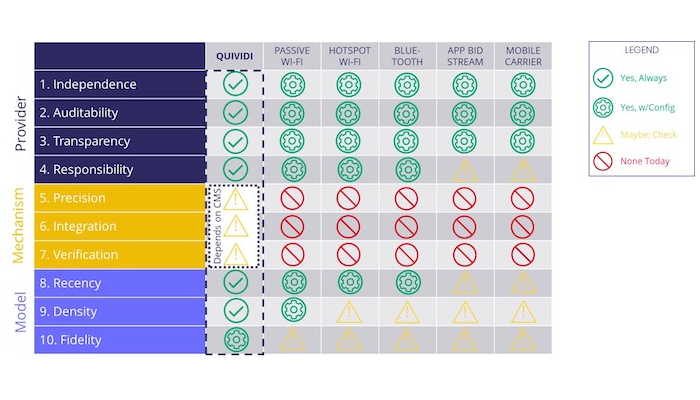
Comparison Grid
- Passive Wi-Fi: sniffs for Wi-Fi enabled devices without offering a hotspot.
- Hotspot Wi-Fi: provides Wi-Fi access via a hotspot and uses sign-ups as data.
- Bluetooth: typically a BLE beacon in reverse mode captures Bluetooth-enabled devices
- App/Bid Stream: Data from mobile apps or mobile ad providers that have access to the mobile user’s geolocation.
- Mobile Carrier: geo-fenced mobile subscriber data of that carrier, anonymized

Quividi is fully compliant out-of-the-box, assuming it is integrated with a capable DOOH CMS.
Combining Quividi and Mobile Data
mobile data is combined with Quividi data such as impressions or attention to measure based on marketing objectives.
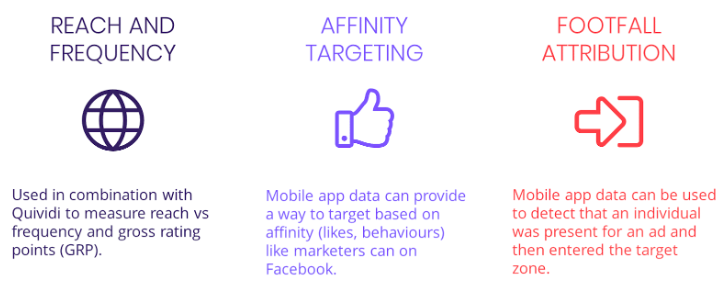
Audience Reach and Frequency
- Audience impressions
- Total venue traffic
The total venue traffic, which can be provided by mobile data with some extrapolation, is used as the ceiling of individuals that can be reached and it can also be used to compare that venue with the total local population. The audience impressions provided by Quividi are then compared to the total venue traffic to determine the frequency and the reach. If mobile data providers also keep track of individual users over several weeks, this reach and frequency can be calculated over longer periods of time.
Audience Affinity Targeting
Store Footfall Attribution
For retailers advertising on D/OOH, mobile data providers offer to calculate attribution of their campaign, by measuring the lift that the campaign generated in footfall to their stores, making sure that, in this lift calculation, they ignore the people that have passed by the D/OOH display and would have gone to the store anyway.
The challenge however is that the estimation of the audience passing-by a display is imprecise because of the low data density and fidelity (particularly indoors). That’s where Quividi can provide a very robust estimate of this audience impression to fine tune the model, and can help as well better estimate the extrapolation factor that the mobile data providers need to ingest in their own models.
Mobile data sources such as telecom carrier data offers further advantages because it allows one to profile and target individuals based on where they have been, e.g. at the competitor’s store.
Conclusion
In conclusion, mobile is a popular alternative to Quividi for measuring audience in OOH. It does not come without problems, however, and not all mobile data is the same. We highlight the potential pitfalls and then explain how it can be combined with Quividi data to get new types of data not available with either mobile data or Quividi data alone.