Quividi, the pioneer and World #1 Audience & Campaign Intelligence platform for DOOH & Digital Signage, has released the fourth edition of iQ Index, its Global DOOH Indoor Traffic Index, aggregating the real-time audience data of its hundreds of customers and their tens of thousands of screens across the globe.
In the third release, Quividi noted several key changes in the audience’s behavioral patterns after the confinement, contrasting traffic data in different indoor venues and regions.
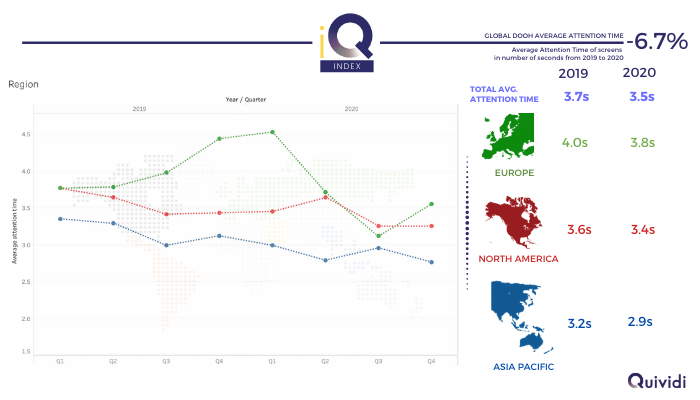
This new iQ Index release uncovers insights on the Average Attention Time of digital signage screens in total number of seconds, comparing the quarterly performances from 2019 to 2020, and contrasting the venues/regions, taking into account the countries affected by the second confinement (notably in Europe).
3.5 seconds: the average attention paid to a screen
On average, a digital signage screen is looked at for a total of 3.5 seconds in 2020.
This figure is one of the KPIs delivered by the real-time and precise anonymous face analytics technology that Quividi deploys on its customers’ public screens. The attention time is defined as the duration between the first moment when the face of a passing audience is turned towards the screen and the moment when that face looks away.
The average attention time was 3.7 seconds in 2019 and 3.5 seconds in 2020, that is, a 6.7% decrease within a year.
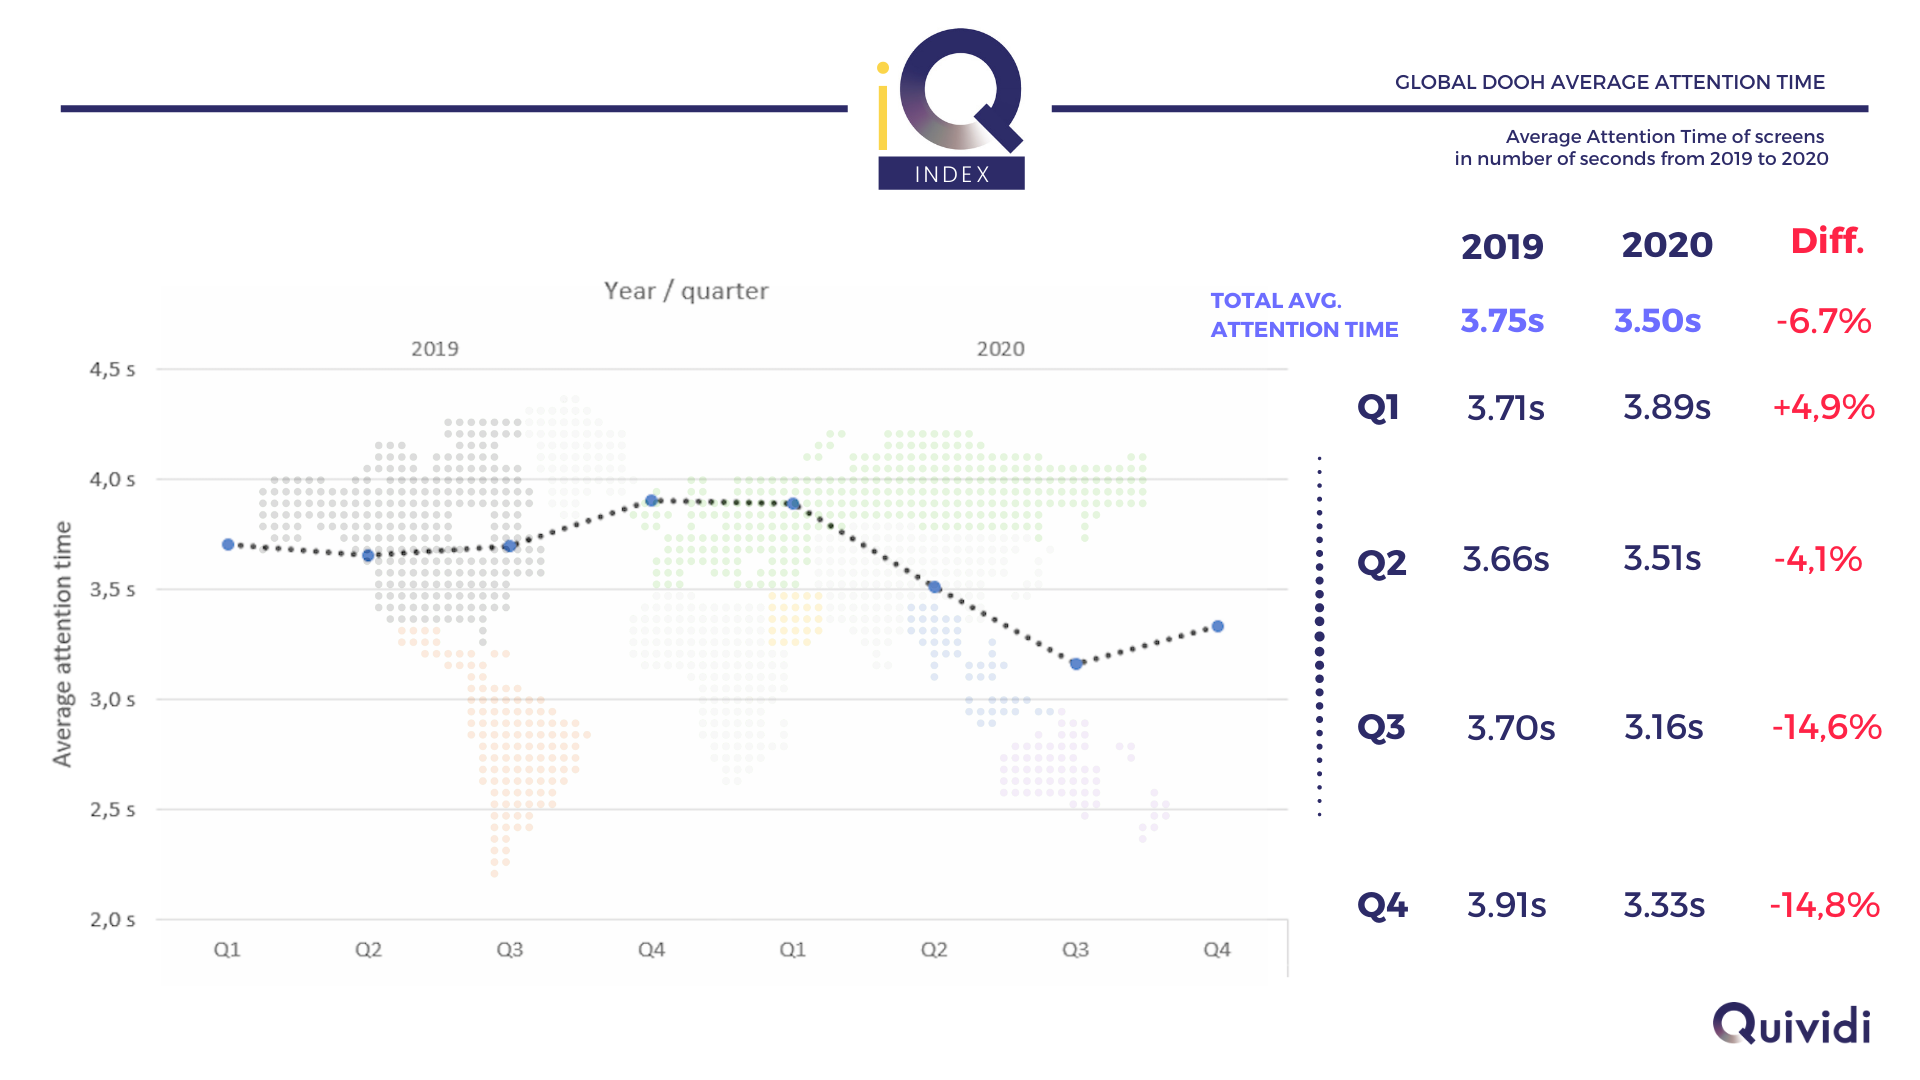 After a 5% increase in Q1 when comparing 2020 with 2019, the average attention time started to decrease in Q2 and reached a low point at the end of Q3 due to COVID. In spite of a pickup in Q4, attention time in the second half of 2020 is close to 15% lower than what it was in 2019.
A Contrasting evolution across regions
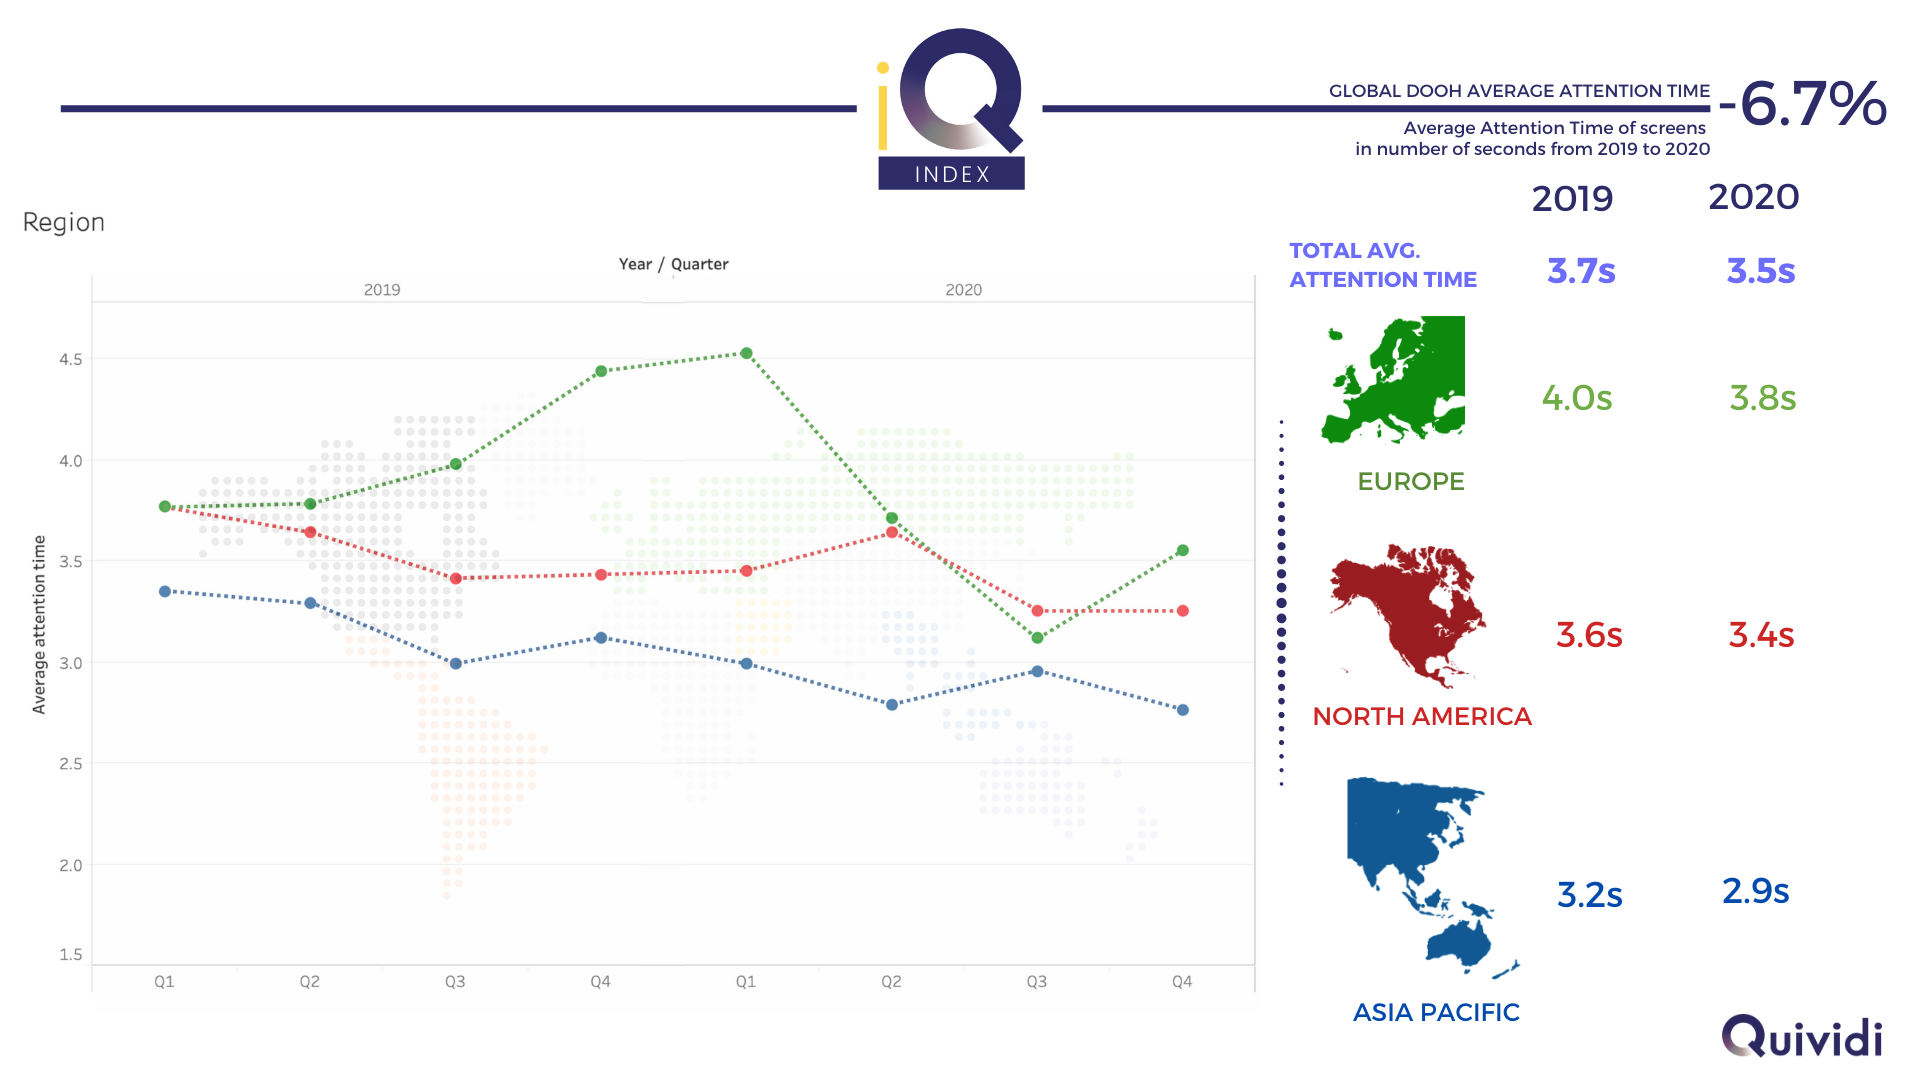
Looking at the overall performance of 2019, Asia Pacific and North America follow a similar pattern whereby the average attention time was the highest in Q1 and the lowest in Q3, whereas Europe, on the other hand, shows a solid upward trend from Q1 to Q4.
In 2020, COVID is seen to have impact largely on the watchers’ behavior in Europe, with the average attention time dropping significantly as of Q2. While the venues’ traffic in North America has also dropped, there has been no major changes in the watchers’ behavior during that same period.
A spread that narrows across venue types
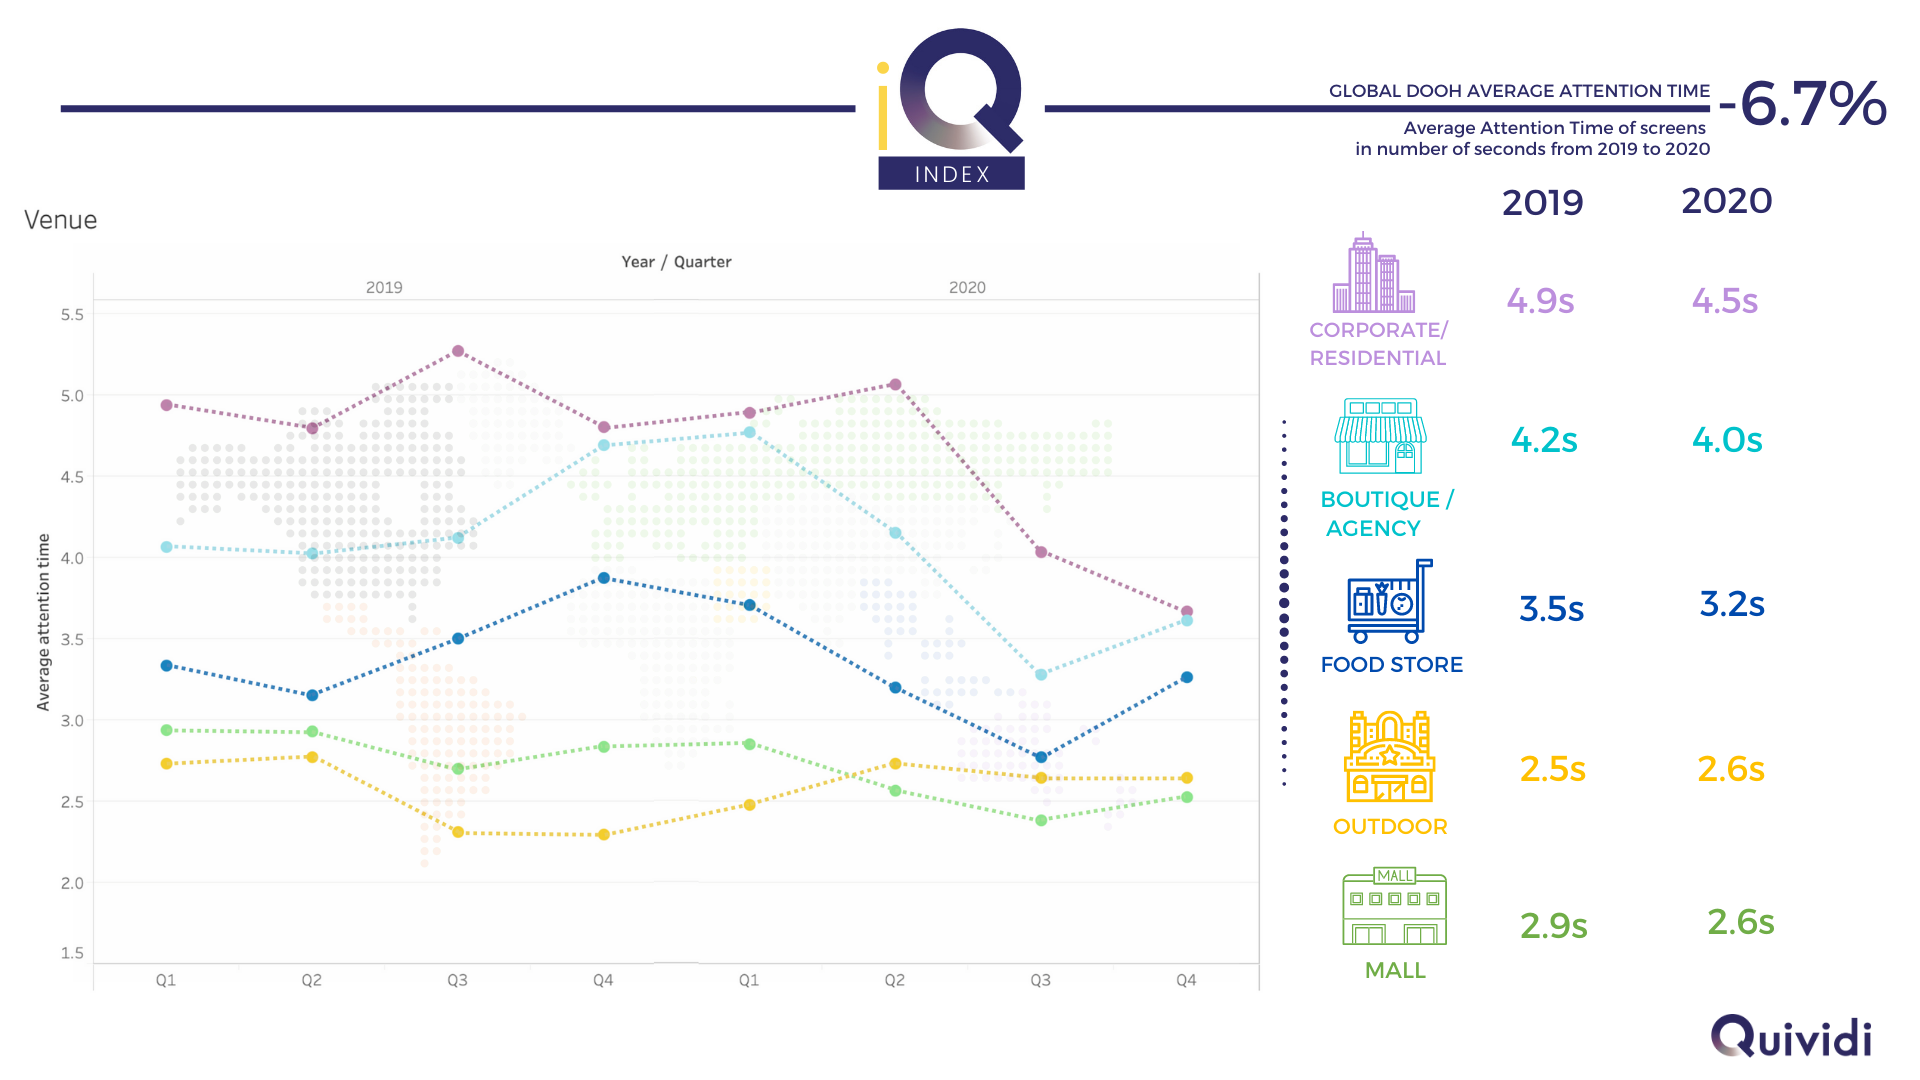
Overall, the average attention time in Boutiques, Corporates and Food Stores is higher in contrast to Malls and Outdoors, where the people are generally more on the go.
However, the attention time difference between various types of venue has narrowed from up to 3 seconds, down to 1.2 second in Q4 2020.